
Much has been written about technical analysis, while equally many times the wrong signals have led to bad investment decisions. Meanwhile even the seasoned chartists turn their backs on well-established models such as Elliott Waves, Fibonacci, or ECRI. Only simple technical trend indicators, which must be interpreted in the context of hard economic data and important business barometers, proved to be more resilient.
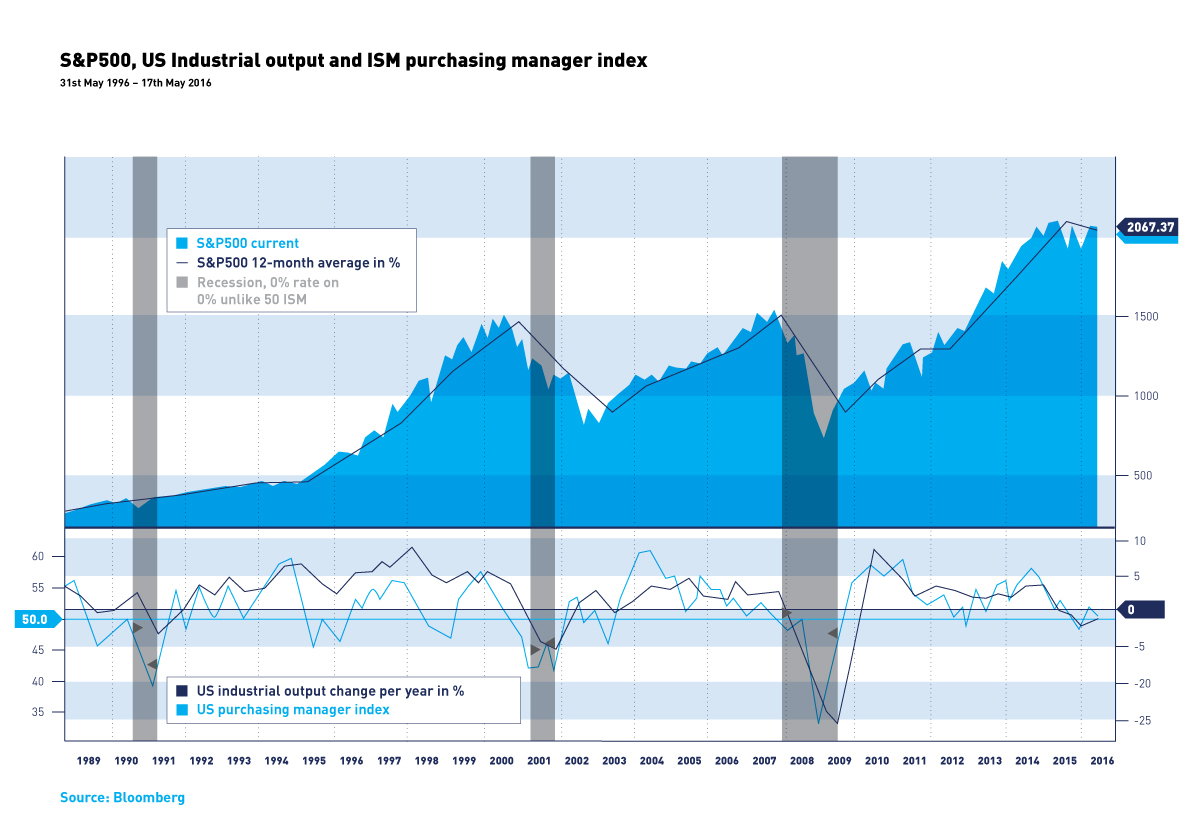
Share trends can turn long before this is reflected in the economic data. Technical analyses can prove very helpful in detecting such trend reversals, e.g. while evaluating long term moving averages trimmed through refined calculation methods (exponential moving average). By way of example, the 12-month simple moving average of the S&P 500 (the most liquid, broadest US stock index) is regarded as one of the most important signals of a trend reversal. Whenever the current index level lies under the 12-month moving average, significant corrections, respectively a bear market can be expected. Unfortunately, also here the predictive power, due to longer lasting lateral movements, is limited. Regulations, declining market making and proprietary trading, more active dark pools, high frequency traders, CTAs, volatility arbitrage and replication strategies have altered in recent years the market dynamics, leading repeatedly to false alarms .
Taking into account hard economic data such as industrial production and influential business climate barometers, notably the ISM Manufacturing Index, can significantly improve the accuracy of technical indicators. In other words, when the industrial production and business confidence indicators in the manufacturing sector are negative (annual rate of change, respectively diffusion indices lie below 50), then the generally accepted recession probability of 10 to 20 percent can increase above 50 percent.
The ISM index fell from October to February under the 50 point mark, indicating contraction in the manufacturing industry and cooling off in the economic activity. Admittedly, the buyers were burdened by a strong US dollar, slump in demand from the energy sector, and an inventory overhang. Since March, however, oil prices have stabilized and the US interest rate expectations have become more relaxed, driving business confidence index again well above 50 points. Above all, the strong recovery of new orders is a positive indication of a rebounding entrepreneurial activity.
Also in the industrial production crude oil prices impact the capacity utilization stronger than in previous recession scenarios, although the non-energy sector seems to have been as yet spared the impact on production levels. However, here the inventories and the enterprise profitability play a more pronounced role. The companies have been finding it difficult to adapt their inventories to changing demand while rising labour costs have contributed to shrinking profit margins. It seems, therefore, reasonable to assume that the risk of a recession, at least in this part of the real economy, has not been yet averted.
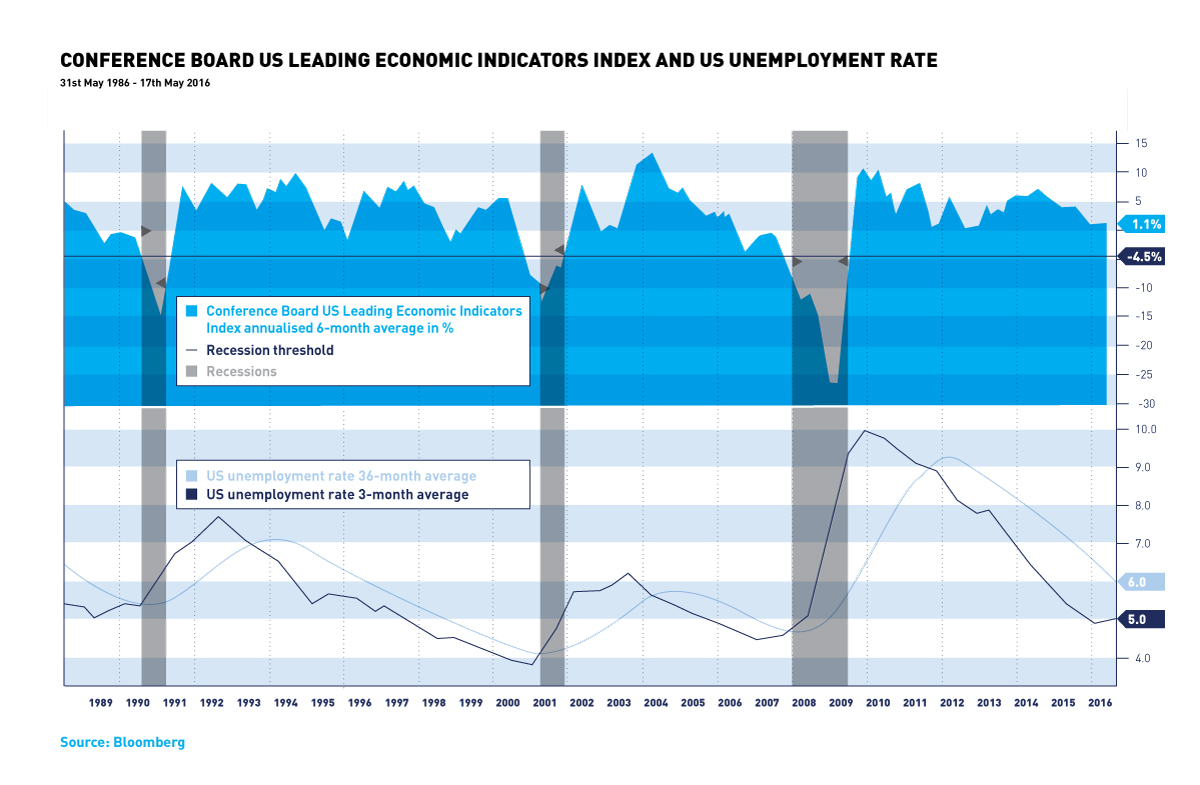
Income based indicators remain on the other hand still far from recession levels. The Conference Board Leading Economic Index, which is derived from 10 official sub-indices in the segments of working hours, wages, layoffs, orders, and the so-called financial conditions (market assessments, risk premiums, financing terms), has scored well above the recession bar of minus 4.5 percent, when 6-month changes over a long run are considered. Here noticeable above all are the low returns (steep yield curve), the stock market recovery, and the sharp decline in unemployment benefits.
This brings us to perhaps the safest recession indicator, namely the development of the unemployment rate. Also here a long-term monthly average over 36 months has been compared with a shorter average over 3 months, whereby the relevant crossover of the moving averages shall herald the trend reversal. Currently, the values are lying so far apart that one would first expect a possible recession next year, unless earlier demand shock in the form of a price boost (oil price), wage hikes (bottlenecks) or the stock market strong decline (consumption, investment) were to occur.
Low productivity, well exhausted cost-cutting measures, with concurrently decreasing profitability and increasing debt of companies have led to a situation, where the US economy is barely steering towards potential growth, albeit without necessary stabilizers. The one-sided support through private consumption illustrates the dependence of the financial markets and the central bank measures. Furthermore, the seemingly robust economic developments are based on overly fragmented markets, therefore, it cannot be ruled out that suddenly again a strong risk aversion will kick in.
By and large, at least from the technical analysis perspective, the end of the bull market cannot be at this point predicted, as yet.
Your Wealth at a Glance.